
More data, more questions: Reconciling Reporting Differences

Registration is open for our May 6, 2026 webinar on this topic.
Most institutions can produce numbers. And to be fair, they can usually explain them too. The challenge is that the explanation isn’t always quick, easy, or accessible in the moment when it matters.
In my experience, this doesn’t show up as some dramatic failure. It shows up in small, familiar ways.
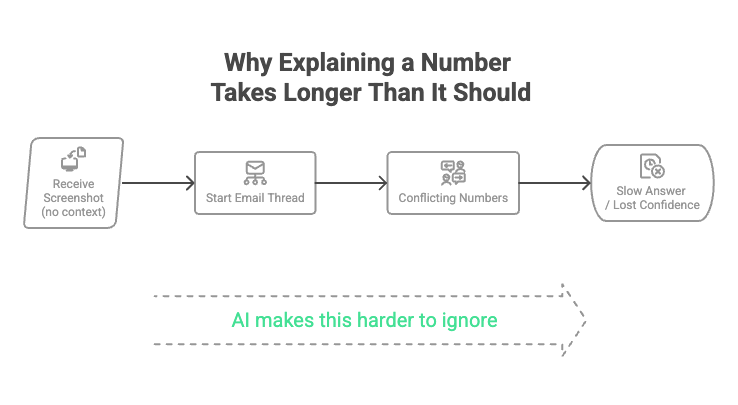
This usually looks something like this:
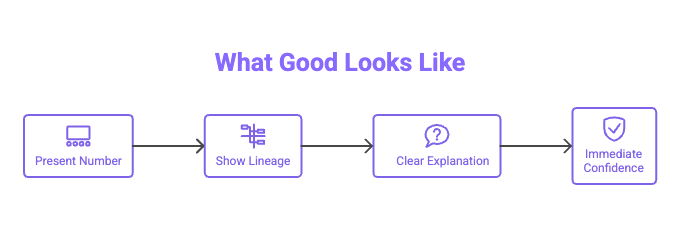
And what is should look like is much simpler:
An email goes out with a screenshot of a dashboard. “Can you confirm this number?” There’s no context. No definition, no date, no indication of how the number was produced. Just an image.
Someone replies with a slightly different number from a different report. Another person chimes in with a spreadsheet. Before long, what should have been a simple confirmation turns into a thread that takes hours, or days, to unwind.
I spent a significant portion of my time in Institutional Research doing exactly this. Not analyzing data. Not advising on strategy. Just reconciling numbers. Trying to understand why two reasonable-looking figures didn’t match, and tracing them back through layers of reports, extracts, and assumptions.
Individually, each number made sense. Collectively, they didn’t.
“We Can Get the Number” vs. “We Can Explain It Quickly”
Higher education has built a lot of machinery to produce metrics. Enrolment, retention, graduation rates, outcomes, funding indicators. If someone asks for a number, there is (almost) always a way to get it.
But when follow-up questions come, like "Why is that the number? or "What/who does that number include?", the process slows down. The answers exist, but they're scattered.
Which definition was used? Which system was the source of truth? What transformations were applied along the way? Has anything changed since the last cycle?
None of these are unreasonable questions. The issue is that answering them often requires digging, sometimes across multiple people and systems, rather than being able to respond clearly in the moment.
The analysts have already moved on to answering a new question for a new end user, and likely thought they covered all the possible questions in the notes or caveats on the original report. Analysts might think the end user just didn’t read them, but the end user may not have understood why the fine print matters. When questions come in, analysts have to change focus and refresh their understanding of the process or calculation before they respond. And this just takes time.
That Was Fine Until It Wasn’t
For a long time, this wasn’t seen as a major issue. Most reporting was internal, and most audiences had enough familiarity with the numbers to work through inconsistencies when they arose. If something didn't line up, there was usually enough trust, and enough time, to reconcile it.
In the past, the analysis offices had technical and time constraints that controlled the expectations of end users for the amount of reporting and the level of detail that would be available in published reports. In institutions with small offices and limited budgets, standard, cyclic reporting was the norm, where no matter the decision, the standard reports were all they could expect to make decisions from.
But the context is changing. New technology enables faster data processing, more transparency into the underlying numbers, data blending across sources, and tailoring reports to specific end user needs. This was fine at first, everyone was excited to create and review new research, and often did so without first establishing a method to document, catalog, or communicate the differences. Analysts could finally answer the questions they always wanted to. Decision-makers finally had data that was relevant to their specific situation. But more information means more questions. This efficiency has led to a new challenge, of institutions increasingly being asked to stand behind their numbers in more formal and visible settings: performance-based funding models, government reporting, public dashboards, and discussions at the Board or Senate level.
In these environments, the standard is different. It’s not enough to eventually explain the number. You need to explain it clearly, confidently, and often on the spot.
Where the Friction Comes From
The challenge rarely comes from a single failure point. It’s usually the accumulation of small, reasonable decisions that don’t quite align.
Definitions seem to drift over time. New data processing capacity enables analysts to tweak metrics and data sets to create reports that suit the unique ask or use-case of a particular end user. "Enrolment" might be FTE at census date in one context, or be registration activity in another, or a point-in-time headcount somewhere else. What is actually changing is the context in which the institution finds itself. - what is being asked, the number of questions asked and the number of people who get to ask them, how and when questions are answered. But it takes longer for institution to learn why those different contexts matter. Each question and answer is defensible on their own, had a reasonable purpose for the intended audience, but when compared side by side, the numbers don't always line up.
Data transformations add another layer. Numbers move from source systems into warehouses, into extracts, into dashboards, and sometimes back into spreadsheets. At each step, filters and business rules are applied. These choices are often known, but not always visible or documented in a way that makes them easy to trace.
Ownership is often implied rather than explicit. A report might be built by Institutional Research, used by faculties, and referenced by Finance. But when a number is questioned, it’s not always clear who can speak to it end-to-end, and often in a meeting where analysts who could answer are not in attendance.
Over time, institutions adapt to this reality. People become very good at reconciling numbers. They know where discrepancies tend to come from, who to ask, and which version is usually right. But this becomes a hidden cost. Highly skilled analysts spend their time resolving inconsistencies instead of generating insight, and the process often depends on institutional knowledge that isn't captured anywhere.
The Moment It Becomes Visible
Most of this operates quietly in the background, until it doesn’t.
A number is presented to a group that doesn’t share the same context. A senior leader. A government body. A Senate committee. Someone asks a simple question: “Can you walk us through how this number was calculated?”
If the explanation is clear and immediate, confidence holds.
If it takes time, or requires follow-ups, additional emails, or reconciling multiple versions, then confidence starts to erode. Not because the number is necessarily wrong, but because its difficult to explain in the moment. Even if you know why, it's still no small feat to translate data concepts into a clear, concise yet comprehensive answer in a language that be understood by the end user. What people can't understand, they're unlikely to trust. And it is the combination of a responding in a short time frame with language that can be understood that makes standing behind a number or report in the moment a challenge.
This leads to a culture of doubt. Uncertainty becomes the norm when reconciling and explaining small discrepancies across reports is prioritized over understanding and analysis of changing institutional trends or identifying themes in student behaviours.
This Is Less About Data, More About Confidence
Most institutions don’t have a data problem in the traditional sense. They have data. They have systems. They have capable people.
What’s harder to build is confidence. Shared confidence that they understand what metrics mean, that data flows are understood, transformations are visible, and ownership is clear. Without clearly documented and shared definitions, no one is confident in what they're reading.
Without that, even good numbers can feel fragile.
AI adds a new layer to this.
As institutions begin to adopt AI tools for reporting, forecasting, or decision support, those systems still rely on the same underlying data environment. These systems don't resolve ambiguity on their own, and AI amplifies whatever is already there (discrepancies and all).
If definitions are inconsistent, the outputs will be inconsistent. If lineage is unclear, it becomes harder to trace how an answer was generated. If the underlying data isn’t trusted, it becomes even more difficult to trust the outputs of an AI system built on top of it.
In that sense, the bar is getting higher. It’s no longer just about whether a human analyst can eventually explain a number. It’s about whether your data environment is structured in a way that both people and systems can consistently interpret, explain, and defend what they produce.
Two steps forward, one step back
As the expectation to explain numbers on the fly increases, many institutions realize the need for data governance and the need to change how they approach reporting, process, and documentation. Rapid advancement and adoption of technology let institutional analysis take two big leaps forward, but doing so without a framework or controls created a culture where everyone feels unsure—forcing institutions to take a step back.
The focus is now on whether we can explain a number quickly and clearly, not whether we can get it—and this is a subtle change in framing with meaningful implications for how institutions approach reporting, governance, and decision-making.
Where This Is Going
In the next post, I’ll dig into one of the most practical ways to close this gap: seeing how data actually flows through your institution.
Because once you can see it, it becomes much easier to explain, and defend.
If this resonates, we’ll be exploring this topic further in an upcoming webinar on outcomes reporting and data lineage.
Registration Open for May 6 Webinar
Retention. Completion. Transfer success. These metrics drive funding, accreditation, and strategy — but often produce different answers depending on where they’re pulled.
In this session, we’ll explore why that happens and how data lineage makes reporting defensible - especially relevant if you’re navigating California’s Vision-Aligned Reporting or similar frameworks.
👉 May 6, 2026 · 10am PDT / 1pm EDT
Live on Microsoft Teams