When Code Stopped Being the Constraint

Welcome back! Hope the start of Fall term is treating you all well. The blog took a hiatus over the summer, but we're back, and ready to rock.
Three things have shifted my thinking this year, and I want to spend the next three posts on them: AI agents, the era of disposable software, and the surprising focus that's come from growing our HR Analytics practice. We'll start today with agents, and carry the other two into the next two posts.
Some of you may know I’m an adjunct prof at the University of British Columbia, teaching Analytics and Interpretation to Master of Engineering students (learn more on the spotlight feature from the program). My journey with generative AI began in earnest through teaching, despite my AI curiosity and the obvious overlap with my work at Plaid.
Because I teach from January to April, I tend to spend the latter months of the year preparing for the course. I’d work evenings in November/December to get ready, and AI was a big part of my preparation process.
But this year, something changed in January (2026): agentic AI.
If I knew in December what I knew by February, I would have changed my course from top to bottom.
Let me back up and tell you more about how I got here.
My journey with AI
Looking back, I started using generative AI in earnest in September 2024 (or at least, that's when I started paying money for it, so add a while before that). It was fun. It helped me rethink my messaging, my approach to blogs (yes, I do still write these), and I had some fun creating terrible AI images (ah, hindsight).
My biggest use, however, was to support getting back into teaching. It had been about five years since I taught my last course, and the audience (master’s level) and focus (broader) of the course was different. As I got started with generative AI in the chatbot era, I found myself using it to synthesize ideas, document where different lessons fit, come up with useful structures, and help me refine material.
One sidebar: I do not use AI for student assessment, nor any student or otherwise confidential data. Even with safeguards, this is a red line for me.
I have strong opinions about what industry professionals can bring to university courses: our lens as professional practitioners, concrete feedback that helps students grow, and to be present to learn how we can best support student goals. Conversely, I do not think we should be wasting time on PowerPoint slides, step-by-step instructions, fiddling with spreadsheets, or other things that frankly don’t need a human.
AI was great at helping me identify the most salient lessons for visual analytics tools like Tableau, which I had taught for over a decade. This helped compress that material into 4-5 weeks instead of 13.
Yet, I was terrified.
The second half of the course focused on using Python for predictive models. This absolutely terrified me.
Given I came out of software engineering, I knew enough of Python that I could read it well, but I did not have the confidence to build interesting things from scratch, let alone teach it.
So what did I do? My first instinct was to read some books on Python, which helped with a few concepts but was tedious. I then turned to ChatGPT and Google's Gemini, primarily. I tried Claude in those days too but didn't find the results great (oh, how things have changed).
These tools helped me ramp up, and fast.
My programming experience, despite being in different languages, was helpful to get going. ChatGPT helped me close the gap on that knowledge step by step, and it gave me an environment where I could ask a dumb question that I felt like I should have known the answer to and actually learn what I had missed.
It was great for teaching those lessons to me, and for organizing and sequencing.
It was also forgetful, so I had to develop some process around it to keep track of all the moving pieces. I had some instances of hallucination, but it was often not a big issue for me. For example, there was a lot of hallucination about Tableau, but I was already an expert and could just fix it. For Python I relied more on testing all the scripts to make sure they did both what I wanted and what the documentation suggested.
In the end, I built up my confidence and was able to teach Python! I couldn’t have done it without my TAs – Bohan in year 1 and Faheem in year 2 – who provided great advice to students and reviewed my examples with an eye to making them better. I taught the concepts, why they mattered, and core syntax; and my TAs worked hands-on with students when problems came up.
My process continued into my second year teaching the course, starting January 2026. I made some good improvements, I think, and worked hard to integrate whatever was state-of-the-art as I re-developed the course in November/December 2025.
That all went well, and I was happy with the improvements.
The agents are coming
Then I started experimenting with AI agents. My first foray was Codex, around January 2026, and I added Claude Code to the mix in May 2026.
It took only a few weeks before I felt I needed to redevelop my entire course around agents instead. We'll see if that holds for next year, but I suspect it will. I’m curious whether the pace of AI development will continue at anything like what we’ve seen recently.
So what changed?
In my view, AI coding agents have completely changed the game for analytics professionals like me who work with data. We're no longer limited by our capacity to produce code. We're now limited by our capacity to decide which ideas are worth pursuing, and our ability to know when to change tracks after pursuing something.
How did I learn that? My experience with AI kept growing, which helped — it had become more of a thought partner in my day-to-day work designing systems and business development initiatives. But that wasn't too different from getting better at using chatbots.
What really helped me improve was solving a couple of things in my life that were taking far too much time for the value they provided.
I was in Japan over New Year's. The international date line tripped me up and I made some mistakes with my expenses as a result. My personal financial life has been planned in Excel for years. It did the job somewhat, but I absolutely hated it. Recurring expenses were a pain, and account balances would be wrong because of a formula that broke. Cleaning it up was taking so much time I was barely doing any actual planning.
So I built a personal finance app, running entirely locally. I'd tried several cloud tools before and never found the right fit. Building it myself with AI meant I could shape it around exactly how I think about accounts, transactions, and funding them. I now spend near zero time on reconciliation and have higher accuracy. I get an alert if my projected balance is too low for upcoming expenses. The app itself is fully local, and the AI tools never see my transactions or other banking info. They’re just building the structure.
Once the finance app worked, I started thinking about some of the processes at Plaid that weren't working well. We've long needed a CRM and have never been happy with existing tools. Typically, we’re too small to fit the mold, and the hard line between CRM and project management tools has meant we either double-enter things or ignore one of the systems. Building it with AI means we can design this for how we actually work with our clients.
As I progressed with this, it moved far beyond the traditional CRM – it now encompasses a wide variety of our business processes and is known affectionately as “Plaid OS”. I’m proud that it fits the way our team works – sometimes visually, sometimes in code, and sometimes driven by an AI chat. It is legitimately saving us time for new project startup and for helping me make sure our new potential work doesn’t slip through the cracks.
A new way to model intake targets
These two projects built my confidence immensely. Next, I worked up my courage and set my sights on Plaid Forecast intake targets.
When we launched Plaid Forecast, we always wanted to make it so users didn’t have to enter 6,000 parameters for their intakes. If you’re not in the strategic enrolment management world, imagine a university with 100 academic programs, 3 terms per year, 2 bases of admission (e.g. high school/college transfer), 2 residencies (e.g. domestic/international), and a 5-year forecast. Multiply those out and you have every individual target you could need, and that’s before getting into internal transfers.
In practice, we find often that the actual number of targets that need real change is 10% or less.
The idea I kept coming back to was an old Tomy Pocket game I had as a kid: you controlled the initial launch, but gravity handled how the ball moved through the rest of the board. I wanted target setting to work a little more like that—you make the decisions that matter, and the system handles the distribution underneath.
In turn, I built something that lets planners set targets at whatever levels they actually care about. You might set an institution-wide target for residency, a different target for a faculty, and specific targets for a handful of programs—all in the same plan. The system then figures out how to distribute whatever is left over across the hierarchy.
A few of my favourites: you can set high-level targets (such as residency) and have the system distribute them across all programs automatically. Or, you can cap certain programs (such as nursing) while letting others grow or shrink. Or, you can adjust your residency mix visually at any level of the hierarchy, which allows you to do things like cap Business at 20% international, and everything else at 15%.
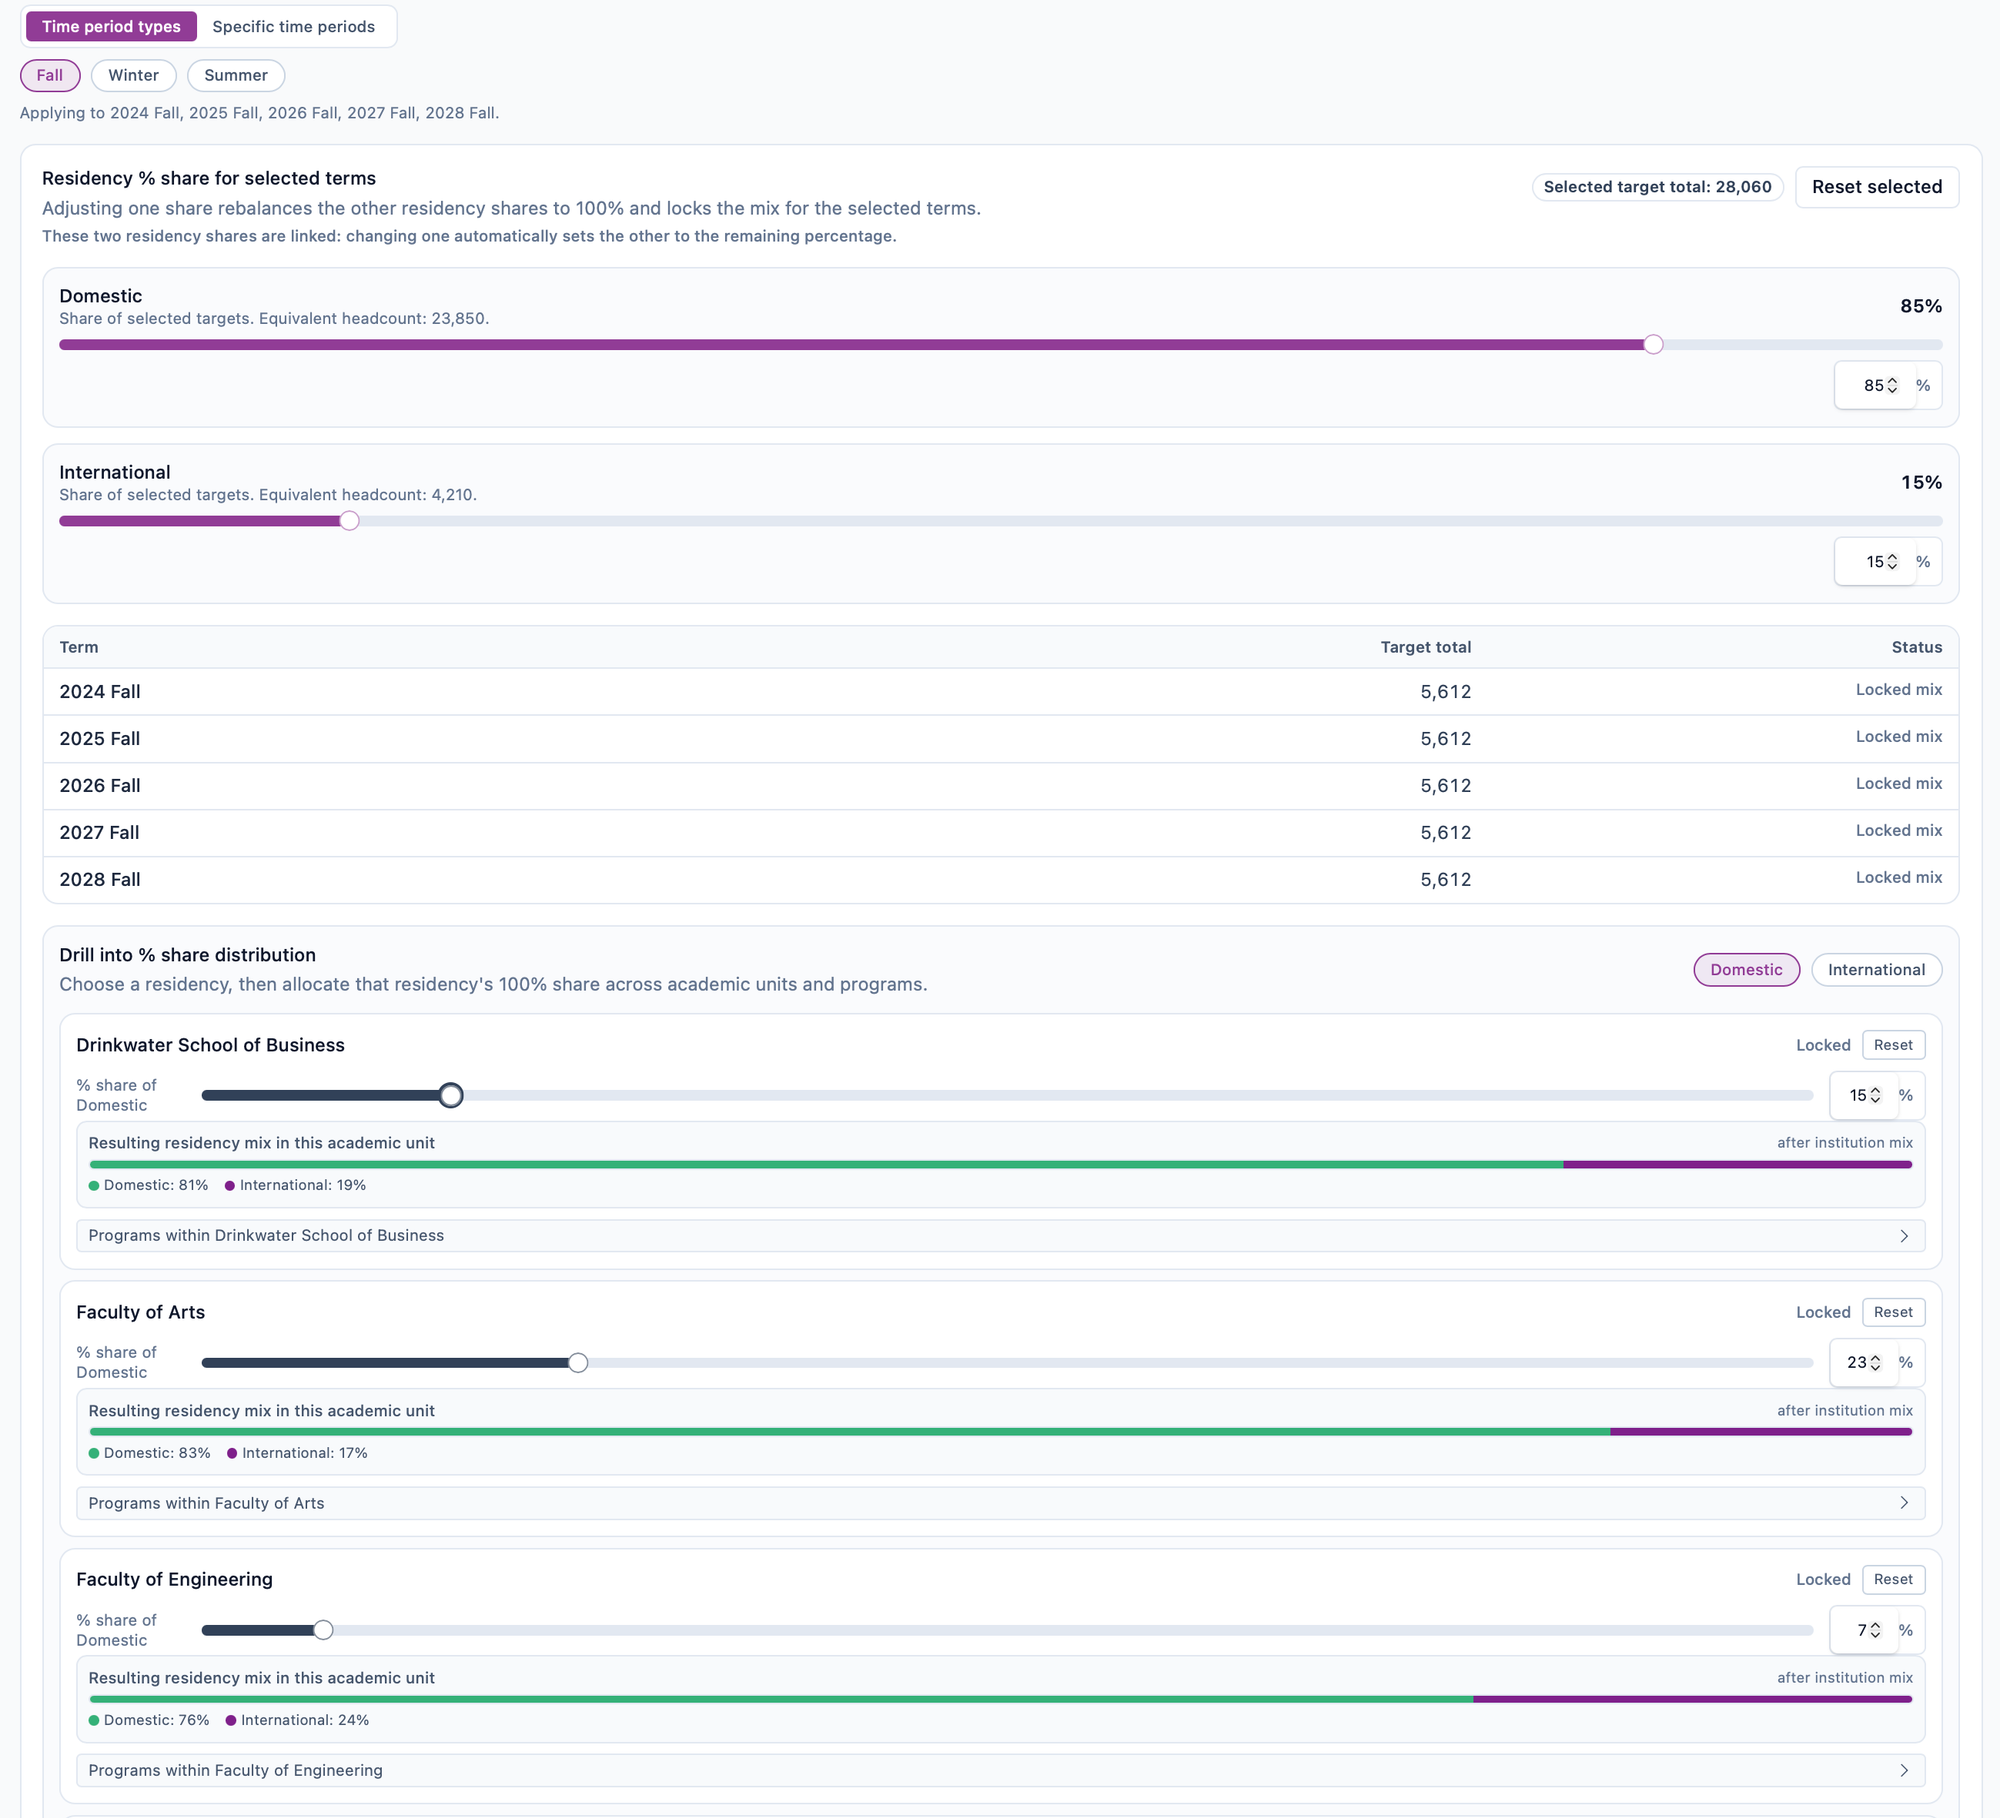
Before this year, that’s the kind of change I would have brought to Pat. This time I just did it. Of course, it’s still a team effort: Pat helped turn my ideas into something that would properly track the changing targets and communicate with the model and do so in a production ready way.
That's the agents post. Next up: what disposable software means for higher education, and for Plaid.