What's Data Governance got to do with it (Power BI)?
If you’re starting to develop Power BI (or other BI) dashboards for the first time, it’s important you set your analysis team up with the tools to build efficient, trusted, and auditable analytics from the outset. Metadata management is key to achieving this. Data governance tools like data dictionaries, business glossaries, and data lineage maps show how data flows and transformations are standardized, document who is responsible for collecting and reporting data, and where its all being stored. "Standardization" is simply the short term for analyst application of data governance rules. Standardization builds trust, improves decision-making, and shortens delivery timelines. Setting up even the basics of metadata management and integrating even just a subject area subset into a centralized, accessible, easy to use tool like Plaid Govern is the start to achieving this.
Efficiency in Power BI comes with setting and adhering to standards before building your data model
Power BI requires data transformation for any typical databases or information from common higher ed information systems (see previous post). Therefore, capturing how your data exists in tables and the table relationships in your database, and the full ETL process to create different reports or flattened subsets of data, will reveal any discrepancies in methods and definitions, and enable your analysts to standardize these before they discover they've built a Power BI data model that only suits one purpose.
Starting new with or switching to Power BI provides the perfect opportunity to review, document, create and apply governance at the earliest point of the data reporting pipeline, so that standardization doesn’t require downstream reporting comparisons, repeated data validation, or redundant definition writing.
The risk of not applying standards before you start building in Power BI is that your analysts will instead find flaws in the data model only after they’ve moved into visualization design in Power BI (but after they’ve built the data model and applied cross-table calculations and filtering). Then they’re left with two options:
1. Track error origination outside of Power BI manually and fix in original location. Rerun all the ETL work that occurs outside of Power BI, restructure the Power BI data model, and adjust the DAX.
2. Apply a quick-fix patch inside Power Query, or write a complex DAX calculation to do the work.
While option 1 is much more time consuming than option 2, it at least means the error is fixed at the source and the Power BI data model can be used for other projects reliably. But depending on deadlines, and whether the analyst thinks this report will be an one-off or the data model doesn’t serve another purpose, they might select option 2. But manual in-workbook fixes reduces the long-term usefulness of the data source if a new challenge or question arises from the dashboard, and negatively impacts the speed of the data source refresh and visualization load times.
Manual metadata management and lineage mapping is a heavy lift that requires librarian-level information organization skills, graphic design skills, and proactive communication (and convincing) all data users to adopt the same system, access and update the same files (likely a set of spreadsheets). Instead, using a centralized metadata management tool like Plaid Govern that automatically ingests your data source structures, generates a business glossary, and creates interactive visual lineage maps, makes getting to the work of process validation, standardization, and governance onboarding fast, so your analysts can start building for long-term efficiency and reliability immediately.
Investing in data governance tools has both short- and long-term payoffs.
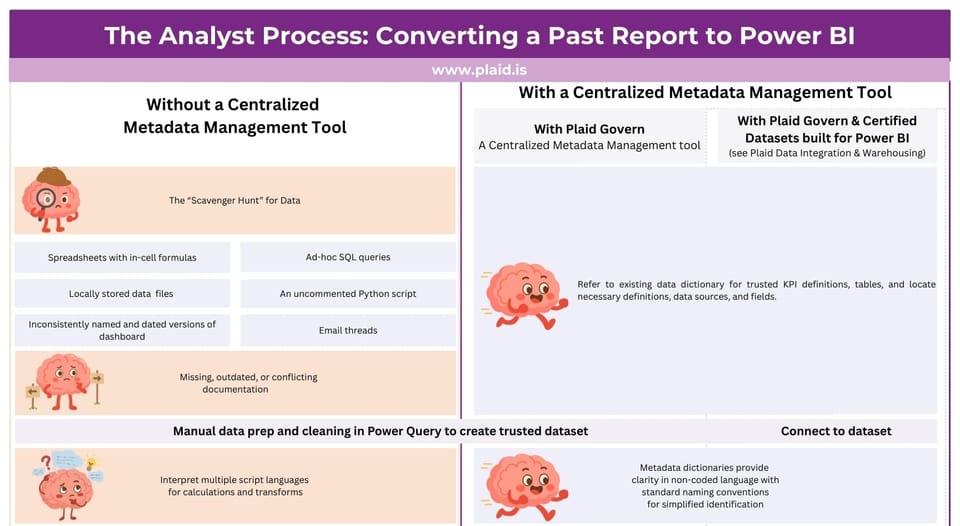
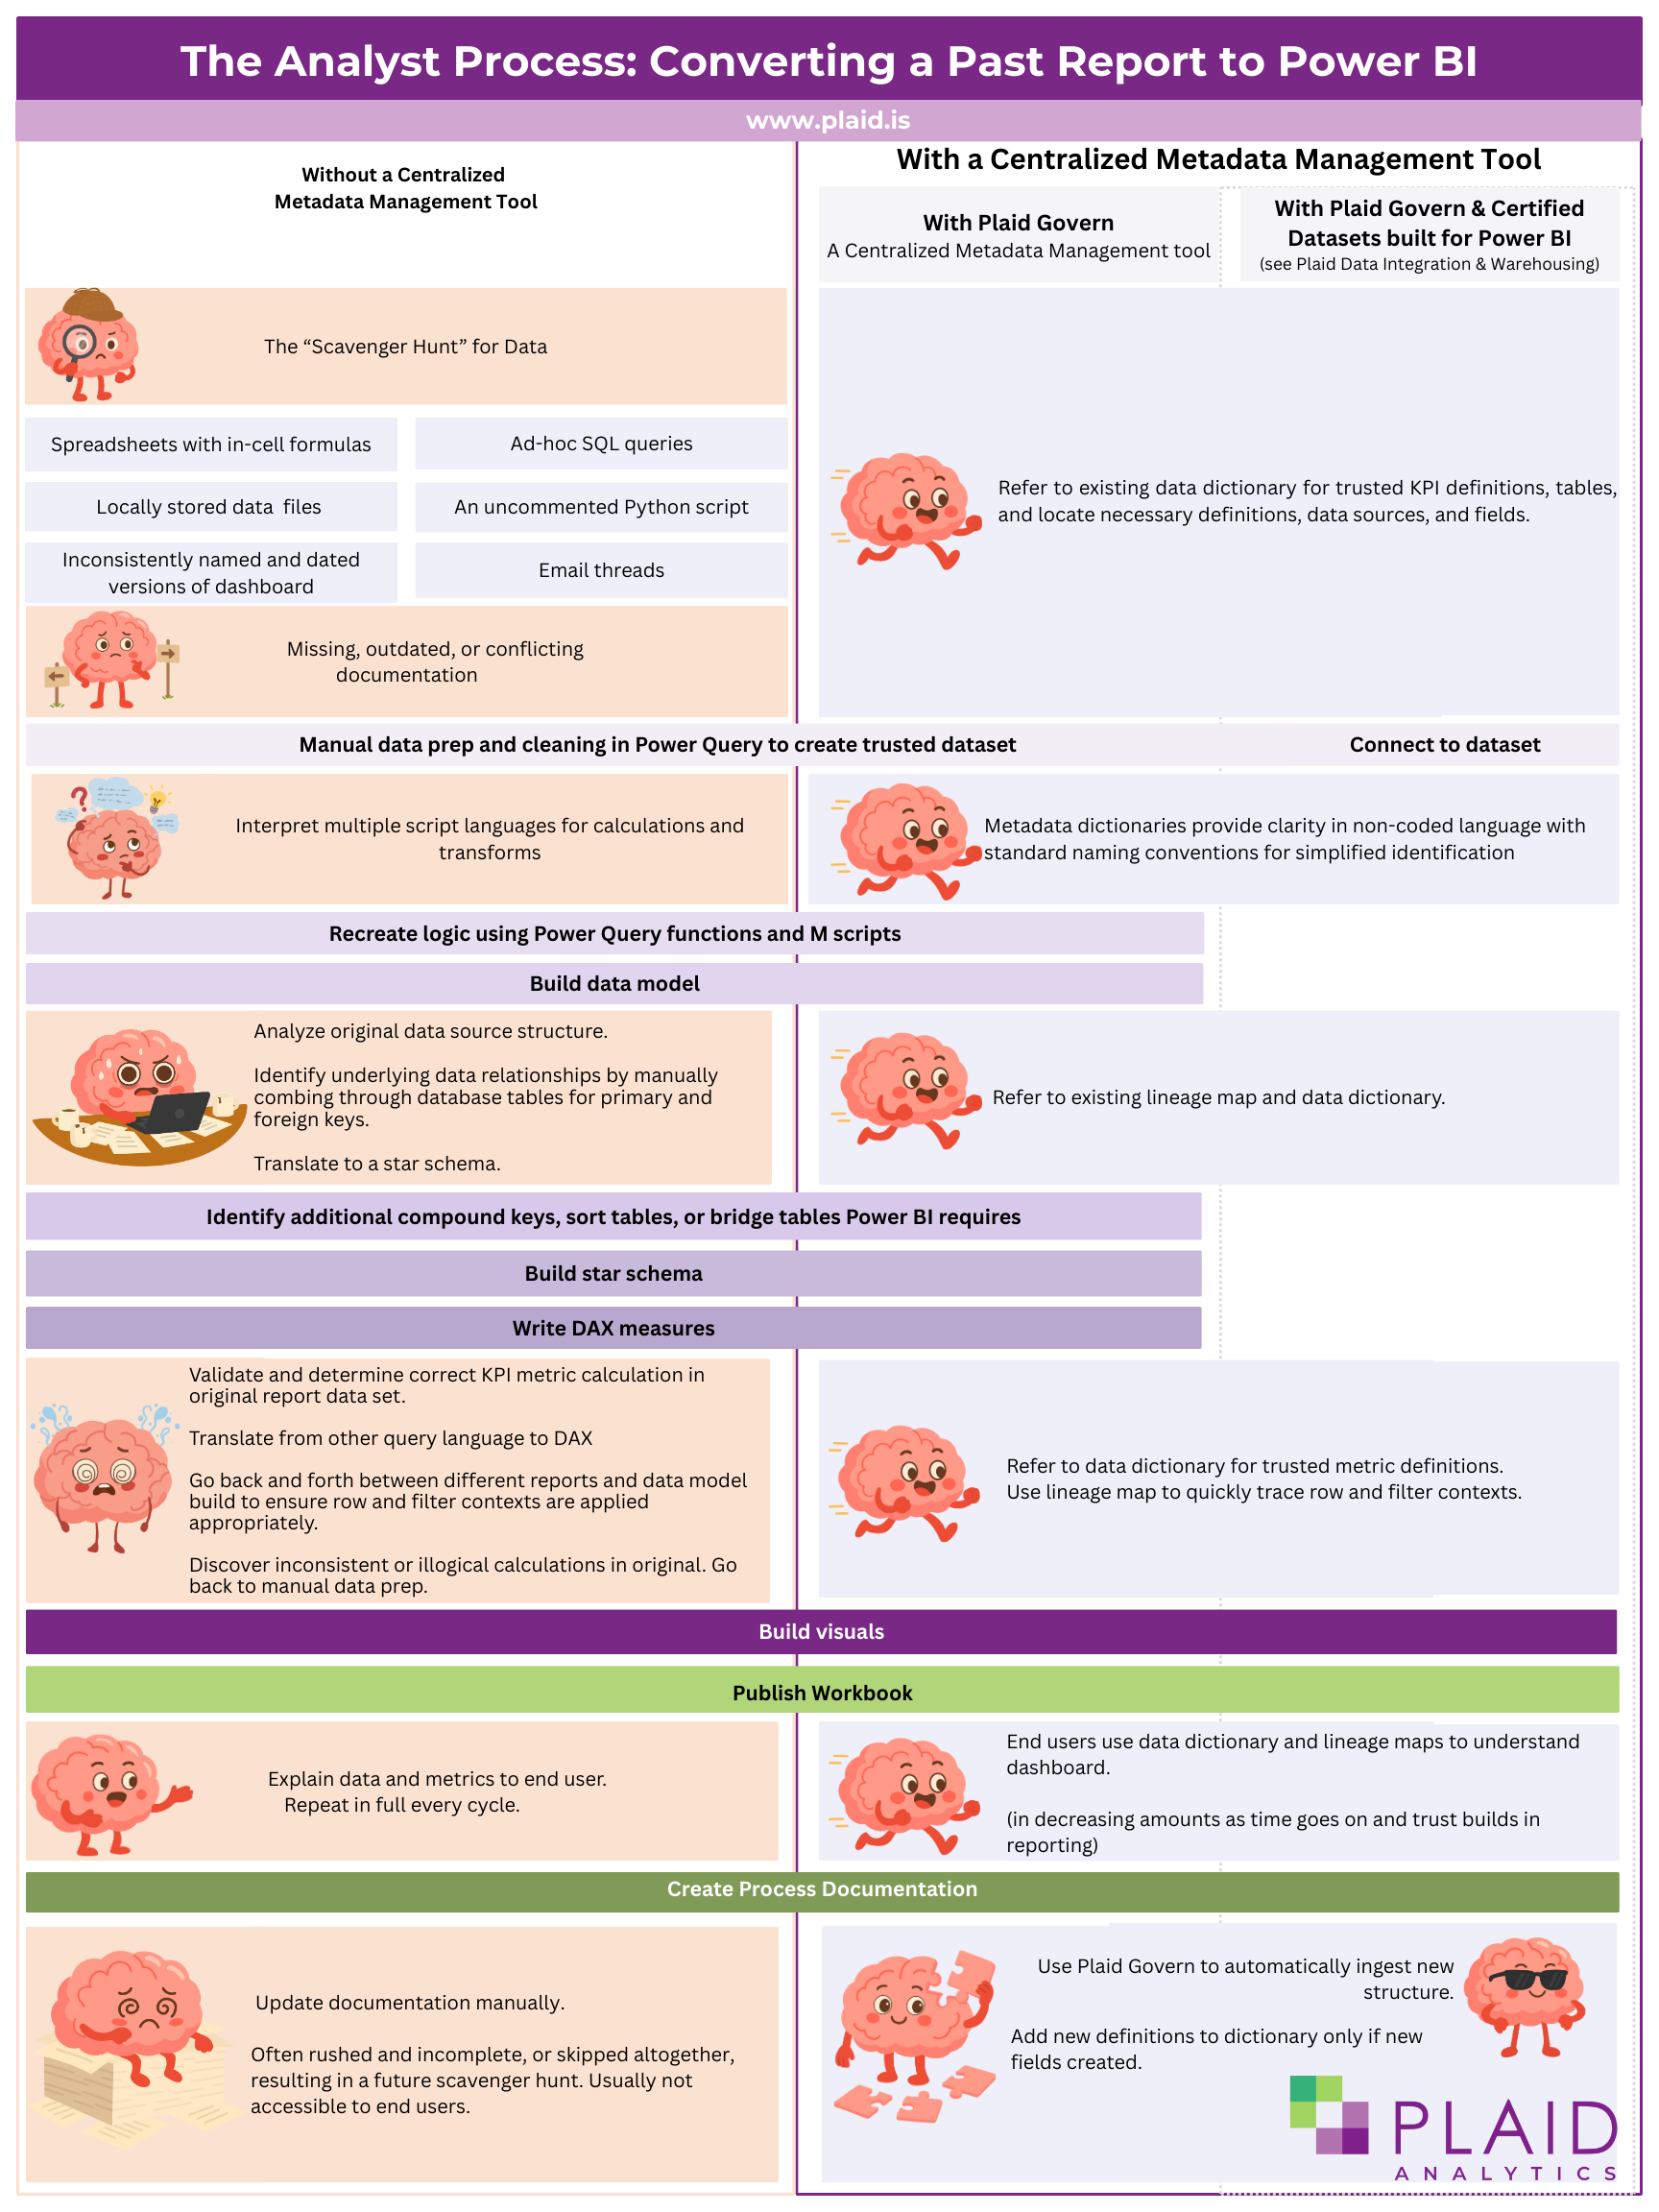
While the initial lift of getting data set up for Power BI is going to be the most time-consuming, in the long-term you'll get compounding returns as developing and launching new dashboards gets faster and faster. Let’s look at what happens with and without a centralized metadata management tool when an analyst is asked to transfer an existing report to a Power BI dashboard:
(click image to open for larger text)
Centralized Metadata Management is a Key Resource for Efficient Communication and Independent Data Literacy Learning
Plaid Govern isn’t just for research and reporting analysts. It’s for executives, deans, registrars, planners, operations and finance, and IT, too. Many IT and IR offices desire, but don’t have the capacity, for a formal data literacy education or communication strategy. Instead, IR offices present new work at meetings, describing the metrics and convincing leadership why they should trust and use the analytics in decision-making. There’s an extra “Notes” dashboard or appendix page in every product to explain the analytical approach, data definitions, caveats, intended purpose, and data source limitations for end users. These are written by different analysts depending on the project, and language can change between deliverables even from the same office, creating a perceived discrepancy between reports, even if the underlying processes were the same.
When Leadership reviews multiple reports for decision-making without standard naming conventions or standard data descriptions, they may infer incorrect report relationship, confuse metrics, and come to distrust analytics due to these inconsistencies.
Instead, direct them to Plaid Govern, where they can search for the report title, the KPI or metric by name, or keyword, and see how its defined, developed, and where it originated from. This is independent data literacy learning, and efficient data communication. Data definitions are only added to Plaid Govern once, analysts can look up the data fields and apply the standard naming convention, and provide links in the dashboard directing users to Plaid Govern instead of footnotes or an appendix. Yes, you’ll still have to communicate to them how to use the tool, and likely present new reports and metrics as they are developed. With Plaid Govern, you do this once, instead of every cycle.
Plaid Govern empowers data and analytics users to inform themselves, and the consistency provided means they’ll internalize the definitions quicker, and decision-making discussions become collaborative and productive, rather than combative about what reports mean, where they come from, and which should be used.
Plaid Govern and IT Efficiency
Information Technology (IT) teams manage data security, which requires understanding what, how, where sensitive information (i.e. data) is being collected, stored, used, transformed, and reported. With Plaid Govern’s visual data lineage mapping, IT security can efficiently audit and document the institutions current practices for data collection, transfer, and uses, and quickly identify data stewards, data producers, and data creators. These are all key metadata that IT needs to identify security risks, plan for data migrations, system upgrades, and manage software licenses and purchases. Since Plaid Govern can ingest metadata from your spreadsheets, student information systems, reporting databases, R scripts, BI tools and dashboards, the more systems you connect, the more efficient IT security audits become. Rather than your data analysts writing new documentation, or sending user access lists for each Power BI report when IT comes asking, they can go directly to Plaid Govern for this information.
At Plaid, we believe in collaborative evidence-based decision-making. We build solutions that breakdown information siloes, improve cross-unit communication, enhance data literacy, and encourage holistic, strategic planning.
Plaid Govern helps you establish a centralized, common-language, visually appealing reference tool for metadata exploration, while enabling efficient and standardized processes for launching analytics with Power BI.