
Too Many Targets, Not Enough Clarity
Last week you may have seen my post on Canada’s new international student targets, and seen the offshoot:
The data nerd in me can't help but scream. If you’ve tried to make sense of Canada’s international enrolment targets this year, you’re not alone - even government releases and national media get them mixed up.
For example:
- The Federal Government: this 2024 October supplement to the Immigration Levels Plan says 305,900 and this announcement from 3 months later says 437,000.
- ICEF says it is 316,276
- The Toronto Star, CBC, and others quotes 305,900 from this week. National Post said 305,000 (close enough)
- University Affairs and The PIE have reported both the 437,900 and noted 305,900 came from the Immigration Levels Plan. University Affairs explicitly issued a correction to clarify this, which suggests that even experts have a tough time figuring out what the government means.
- The PIE also reported 437,000 for 2025 without the context of the 305,900 probably being the better comparison for 2026 (though you can find it if you click through links)
Why this is a data governance problem
So look. This is a classic data governance problem.
Inconsistent or fragmented data isn’t just a technical issue.
Having targets scattered across supplements, budget documents, and media releases, without a single authoritative source or even a consistent definition, means no one can clearly connect targets to actuals, and we see unclear messages like those I highlighted above.
Good data governance is supposed to prevent these kinds of honest mistakes.
In a well-governed environment, you’d have:
- A single source of truth for key metrics (e.g., study permit targets and actuals)
- And if I may so suggest, a modern API to get data out of that place.
- Clear data lineage showing how each figure is derived and how it relates to other metrics
- Version control and publication consistency so analysts, institutions, and journalists are working from the same definitions
Without that, everyone builds their own interpretation and their own stories. Trust in the data erodes.
Wait, what target?
Part of the confusion also comes from the types of targets being mixed together.
If we borrow a higher ed analogy, it’s a bit like the admissions funnel:
Total Temporary Resident Target → Total Study Permit Target → New Study Permit Target
Each level narrows the group, but the government (and media) often reference them interchangeably. That makes it nearly impossible to tell whether a headline refers to new permits, renewals, or all current holders.
Even IRCC’s own dashboard doesn’t make it easy to trace those relationships. The data are visualized well, but not easily downloadable. Instead, they link to Canada’s Open Data portal, where the versions don’t always match. For instance:
- Temporary Residents: Study Permit Holders – Monthly IRCC Updates hasn’t been refreshed despite an updated timestamp.
- Study Permit Holders - Ad Hoc IRCC (Specialized Datasets) extends to August 2025, but the totals don’t match the dashboard.
If you know where to find a clean, consistent source that connects the targets to the actuals, please let me know – I feel like I must be missing something, but it sure looks like I’m not alone.
These targets(?)
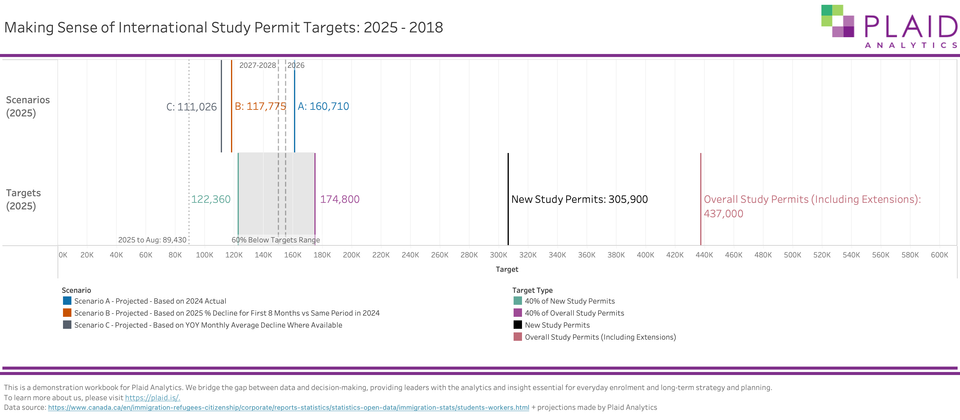
Here’s my interpretation of the targets, the actuals, and potential scenarios surrounding them.

The new target of 155,000 in 2026 and 150,000 in 2027 and 2028 appears to be for new students. Actuals aren’t in yet for 2025 (and they have only published up to August when I write this in November), but news articles suggest that 60% below target is likely (unclear whether that is overall or new only) and result in a range between 122,360 and 174,800. Plaid’s simple scenarios based on the year over year declines in new permits issued suggest 2025 will land between 111,026 and 160,710. You’ll note these forms of projecting actuals are pretty close to what the government is targeting in 2026 and beyond. From this vantage point, the worst could be over, but as you know we consistently send poor messages to prospective students and make them think our country doesn’t want them.
Targets change, and that’s normal. The problem is not knowing how or why.
Targets can and do change, and sometimes they should.
Forecasting and planning rely on new data, changing assumptions, and evolving policy contexts.
There’s nothing wrong with a moving target; the problem is when we can’t trace the movement.
A quality data governance program makes those changes visible. It should be easy to answer:
- When was this target last updated?
- What was the previous version?
- What triggered the change?
- How does this version compare to what was originally planned?
Without that audit trail, you end up in the situation we’re seeing now: multiple “official” numbers, none clearly related.
A parallel from forecasting
In forecasting, we often generate dozens of scenarios: high, low, policy-adjusted, institutional, regional, and so on.
Part of doing this responsibly is having governance around:
- Which scenario is active when
- How assumptions evolve over time
- How results are named, archived, and documented
That’s how you maintain clarity in a world of constant change. The same principle should apply at the national level: if we can track 30 versions of an enrolment forecast, surely we can track many versions of a federal target.
Why am I ranting about data governance in a budget?
Data governance isn’t just about compliance or IT hygiene. It is supposed to help people make better, well informed, decisions.
When even the national data on a subject this important is hard to reconcile, it undercuts everyone’s ability to plan responsibly - from policymakers to institutions to prospective students.
Without clarity and consistency, we risk drawing the wrong conclusions from the right data, and we spend time on low value activities like reconciling information.